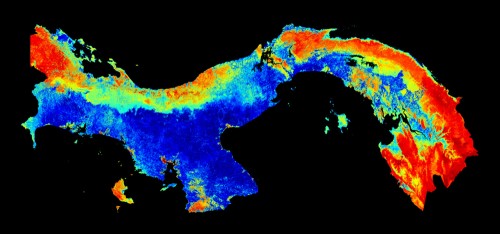
The first high-res national carbon map. (Courtesy: Carnegie Airborne Observatory)
By Madeleine Fowler, who is doing a work experience placement at Physics World
Panama is a country of diverse ecosystems and complex landscapes, with vegetation ranging from grasslands and scrublands to dense forests. This makes it the perfect location for scientists to experiment with different methods of measuring above-ground carbon density – carbon that is locked up in vegetation.
Scientists have now mapped the above-ground carbon density of the entire country, which is a first in the world of carbon mapping. Field data and satellite data were integrated with high-resolution airborne light detection and ranging (LiDAR) data. This made it possible to create the first carbon map that could quantify carbon stocks in a local area as small as one hectare. What’s more, it can do this over millions of hectares.
The new combined method of LiDAR, satellite and field data gives the lowest uncertainty of any carbon counting approach, as this combination of data gathering is able to account for variations in carbon patterns. These measurements will form a stepping stone for scientists who are aiming to estimate the total amount of carbon locked inside plants. It is thought that this new system of gathering data could greatly improve the conservation of vegetation and through this make climate change less severe through carbon sequestration.
The United Nations Collaborative Programme on Reducing Emissions from Deforestation and Forest Degradation in Developing Countries (UN-REDD) aims to protect the forest resources of developing countries by creating a financial incentive for these countries to keep their forests. They will make the trees more valuable while standing than they would be when harvested, by creating financial value for the carbon stored in trees.
Eldredge Bermingham, a researcher and director of the Smithsonian Tropical Research Institute (STRI), said “Panama is one of the first UN-REDD partner countries, and these new maps put the country at the forefront of high-resolution ecosystem management.”
Research shows that the highest carbon levels are in the humid forests on the Caribbean side of Panama, often exceeding 110 tonnes of carbon per hectare. In contrast to these figures are those of the deforested and developed regions, which have very low carbon levels. This shows that human activity is the number one driver of above-ground carbon density in Panama.
Traditional methods of carbon monitoring relied on the ground sampling of field plots. Satellite imagery is also often used but it gives low spatial resolution and also gives little information on the structure of the vegetation. The LiDAR method probes the ecosystem’s physical structure using a laser to image the vegetation and canopy structure in 3D. These measurements are taken at 1 m resolution over 228 regional field plots (390,000 hectares). The researchers then used 91 other field plots to validate the LiDAR’s carbon-density estimates.
The team of researchers was made up of scientists from the Carnegie Institution for Science, the STRI, McGill University and the University of California at Berkeley.
Guidelines
Show/hide formatting guidelines
this text was deletedwhere people live in harmony with nature and animals</q>
Some text