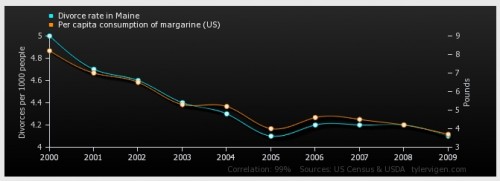
Do divorcees eat more margarine? Or does the butter substitute break up marriages? (Courtesy: Tyler Vigen)
By Hamish Johnston
This week’s Red Folder begins in Japan, where the 2011 disaster at the Fukushima nuclear power plant continues to cause misery for the 100,000 or so local people who still cannot return to their homes. But who is to blame? Writing in World Nuclear News, Malcolm Grimston of Imperial College London argues that radiation levels in much of the current exclusion zone are no higher than natural levels in other parts of Japan – and much lower than natural levels in some other populated regions worldwide. Grimston concludes that “an overzealous infatuation with reducing radiation dose, far from minimizing human harm, is at the heart of the whole problem”. His article is called “What was deadly at Fukushima?”.
A lack of trust in science and scientists is likely to be at the heart of the paradox that Grimston bemoans. I’m guessing that Japanese radiation experts are not keen on arguing for a return to safe parts of the Fukushima exclusion zone because no-one will listen to them. That is the sad message of an article in the Guardian, “Crisis, renewal and the prospects for science advice in Japan”. Written by two Japanese academics, the piece argues that “public trust in both science and policymaking was severely damaged” by the confusing and often conflicting statements from scientists and government officials in the wake of the 2011 earthquake and tsunami.
Perhaps many of the Fukushima evacuees would be back in their homes if officials had a better grasp of statistics. Promoting a better understanding of how to interpret data is one goal of a delightful website called Spurious Correlations, which takes a do-it-yourself approach to lampooning that age-old fallacy of assuming correlation is causation. Readers can select two sets of seemingly unrelated data, which are plotted together and the correlation is calculated. I chose “online revenue on Thanksgiving” and “the number of lawyers in West Virginia” and you can see the remarkable correlation of 0.99 here.
The site was created by US law student Tyler Vigen, who hopes it “fosters interest in statistics and numerical research”. My favourite correlation links the divorce rate in Maine to the per capita consumption of margarine in the US (see image above), which is also at 0.99.
As the nuclear energy produced in nuclear reactors has a very high density: about a million times more that the systems based on atomic chemistry, one has to be very careful as to their physical structures and their geographical location coupled with an utmost vigilance and responsability for their operation, their eventual dismantlement and the control and disposal of the resulting radioactive waste. In all the reactor “accidents” in the world so far, one these elements was missing.
A small survey of radiation levels in Japan.
Micro Seivets/hour ( gamma )
Ito 0.11
Kyoto 0.16
Totory 0.12
Iwami Ginza
( Silver mine ) 0.9
Kudamatsu 0.16
Ako 0.18
Tokyo 0.12
Juki 0.15
Hiraizumi 0.13
Tohoku 0.14
Morioka 0.12
Fukushima city
Central 0.13
Suburbs
1 metre outside 0.27 – 0.33
ground level 0.68 – 0.71
Inside 0.14
Ashford Kent 0.13 Radon 22 Bq/m3 about 0.15 microSv/hr
For most Japanese houses away from city centres, the roof rain water is channelled into the ground and levels in the adjacent ground can double.
The annual level for Ashford is there fore 2.45 milli Sv/year. Taking the 1 metre level at Fukushima city and assuming a similar Radon level yields 3.94 milliSv/year an increase of just 60% compared with Ashford.
Marin, these are the “normal” radiation numbers, but the things can be dramatically different in the case of a reactor accident, because a nuclear reactor, during its operation, is, indeed, a carefully controlled atomic bomb!
It depends what you call normal, Fukushima registers slightly higher than most places.
In the 1943 Tonizo (Tokyo No.2 Arsenal) documents it refers to uranium deposits at Iizaka-mura which use to be a village outside Fukushima but is now in the northern suburbs. Also is mentions Ishikawa-machi just south east where uranium was mined in 1944.
Martin, there are the granitic places or places with the Uranium deposits in different parts of the Earth, where understandably the local radioactivity due to Radon mostly, is higher than other places. The “normal” radioactivity is meant to be for the places away from these spots.
I think Ashford in Kent can be considered quite far away from any granite places !
Radon is monitored 24/7 and a few days ago it reached 30 Bq/m3 in the early morning outside ( nocturnal inversion). Sub-ground level at the moment is 480 Bq/m3 but indoors it hovers at 23 Bq/m3. Some of the head deposits ( solifluction ) along the base of the chalk escarpment have registered 15000 Bq/m3.
The average for the UK is reckoned to be about 20 Bq/m3.
Sounds to me like you guys are arguing about the statistician who drowns crossing a stream of average depth of about 3 feet. Naively (me), it would seem reasonable that nuclear waste indiscriminately spread around (as in a disaster) is likely much more concentrated in spots than more-or-less “naturally” or randomly occurring sources (like maybe radon in the ground). So it might behoove a person to be more careful exactly where they step (or live) in the vicinity of the non-random “deposits.”